
All-in-one shampoo + conditioner + body wash. Ninja 10-in-1 multi-cooker. The Taco Bell 12 layer burrito.
What do these all have in common? Despite their usefulness, in trying to be everything at once, they end up doing nothing especially well.
Think about it - if you want a close shave, are you going to choose the electric razor/nose trimmer/styler combo, or are you going to use a straight razor?
NBA analytics follows the same truth - as useful as a single metric to value a player is, it’s inherently met with limitations. However, with care, we can add as much context as possible to measure players’ contributions and value.
Though it may be a fool’s errand, I aim to do exactly that in this post - I’ll be attempting to create a best-in-class single metric to value players with a focus on both efficiency and usage.
Where to Start
Ideally, this metric should capture a player’s impact on winning.
The simplest metric to start from is plus-minus, which captures how much the player’s team outscored their opponents with him on the court.
Let’s look at the top 20 players by plus-minus since the 2021-22 season:
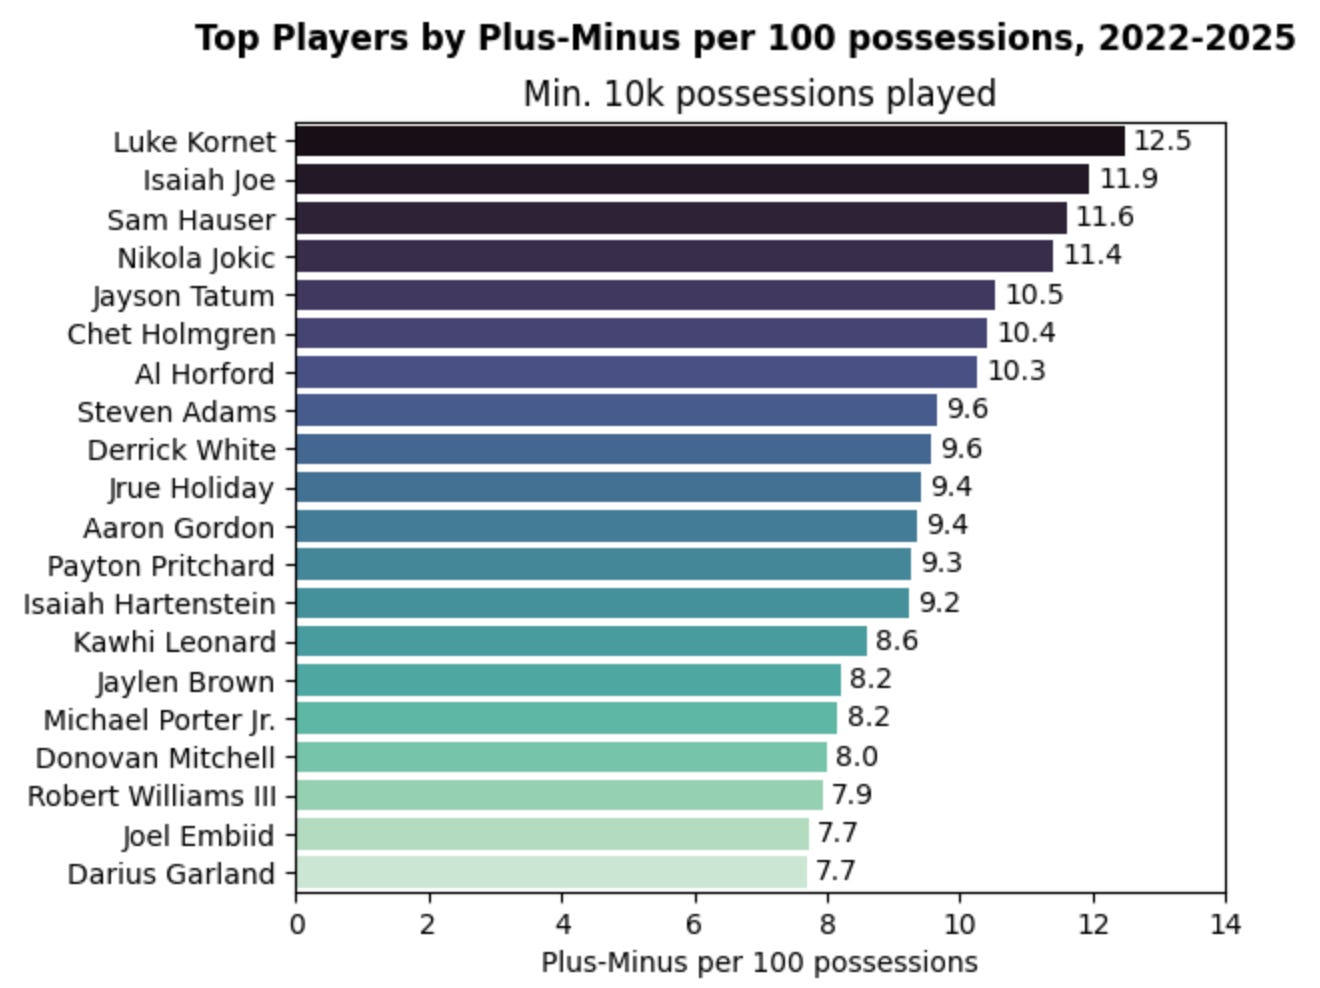
While some familiar names like Nikola Jokic, Jason Tatum, and Joel Embiid pop to the top, some names here might surprise you - Luke Kornet at #1? Isaiah Joe at #2?
Kornet and Joe both heavily benefit from being on teams that have found great success during this period in Boston and Oklahoma City. Even though plus-minus is the most directly tied to winning, it doesn’t separate a player’s impact from team success.
For example, on December 16, 2015 against the Phoenix Suns, Andrew Bogut scored 0 points, didn’t attempt a field goal, had 4 fouls, and 3 turnovers in 21 minutes. He was +42 on the game.
With enough sample, plus-minus has more validity, but it’s still missing one of the key components - who each player played with and against.
Adjusted Plus-Minus
Adjusted plus-minus (APM) aims to adjust plus-minus for who a player played with and against.
This stat, developed in the early 2000s by Jeff Sagarin, Wayne Winston, and Dan Rosenbaum, uses a matrix and system of equations to understand player impact. It uses a regression on individual lineup combinations to isolate individual player impact.
The system of equations essentially creates coefficients for each player on both offense and defense, representing their impact on each end of the floor. We can add these offense and defense coefficients together to create one APM number for each player.
Taking a look at APM over the same time period:
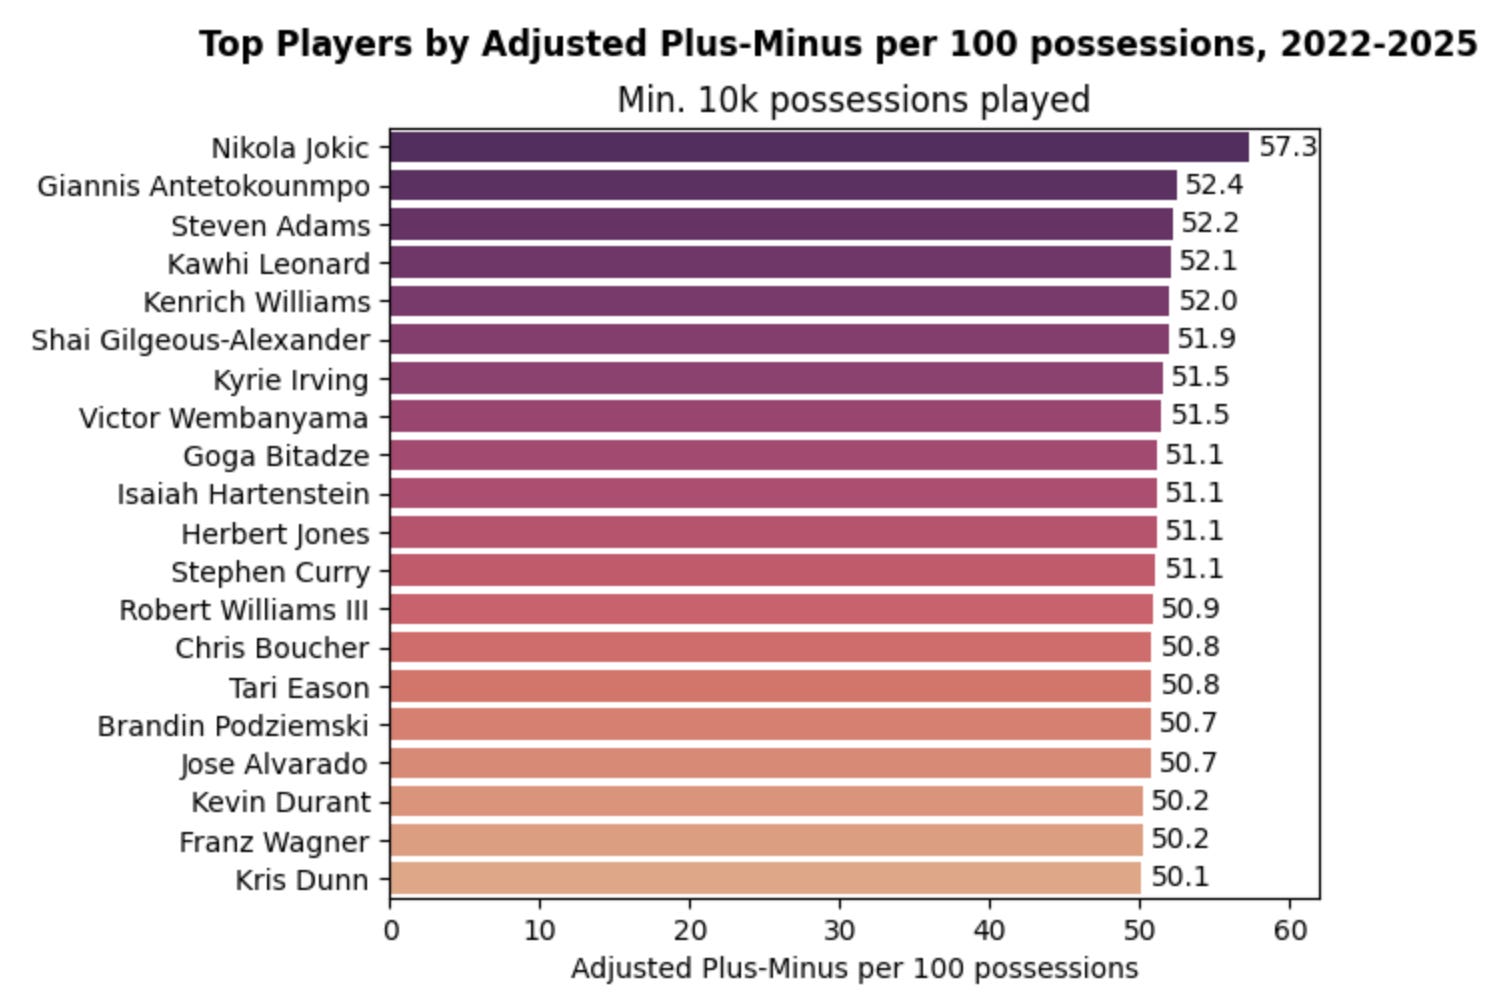
These results match our understanding of top players a bit better, featuring Jokic, Giannis, SGA, Curry, Durant, and more.
Note these values are much higher than plus-minus, with the leaders above 50 per 100 possessions. In machine learning, this is known as overfitting. In basketball terms, although APM is a serious improvement over plus-minus, it attributes everything that happens in the game to the 10 players on the court.
This might sound reasonable, but let’s not forget the impact of coaching, scheduling effects, team strength, and more - there’s still significant room for improvement.
Improving on APM: Regularized Adjusted Plus-Minus
Regularized adjusted plus-minus (RAPM) essentially takes everything we did with APM and applies a regularization parameter alpha to guide coefficients toward 0.
This parameter helps prevent overfitting and removes some of the noise, allowing us to better isolate a player’s impact.
Let’s evaluate the top players by RAPM since 2022:
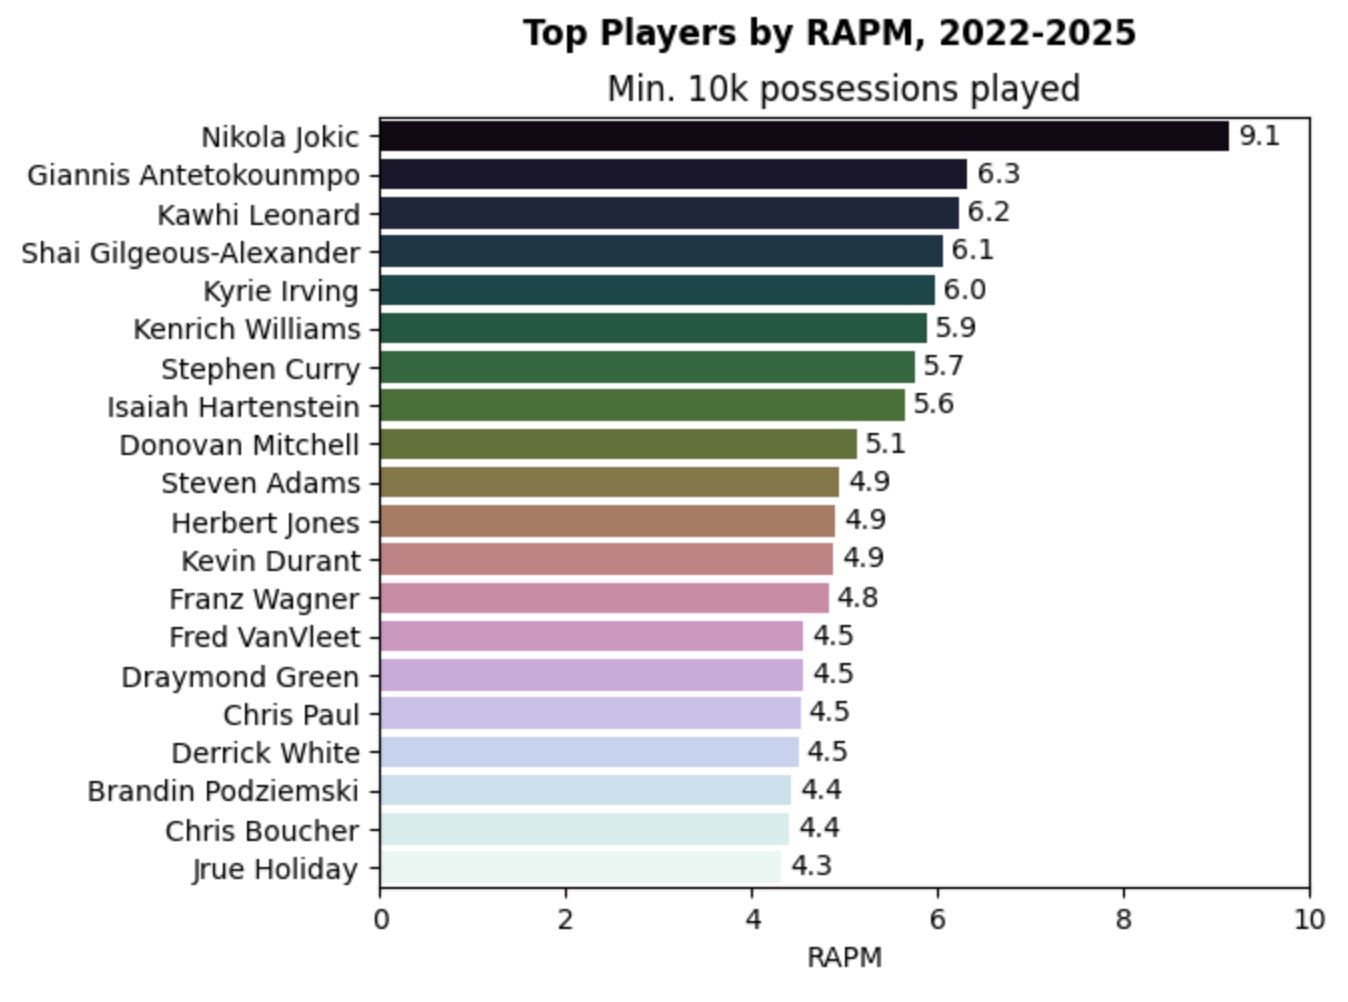
While some of the names appear the same from APM, we’ve seen some names like Goga Bitadze, Robert Williams III, and Tari Eason get replaced with Donovan Mitchell, Draymond Green, and Chris Paul. I don’t want to meddle with our models until we start seeing familiar names, but this is a sign that we’re heading in the right direction.
This chart also captures just how much Nikola Jokic is ahead of the pack in the last four seasons, with his 9.1 RAPM 44% higher than second place Giannis at 6.3.
I mentioned previously that these system of equations allow player readings for both offense and defense - let’s take a look at where the top players earn their RAPM on both sides of the ball:
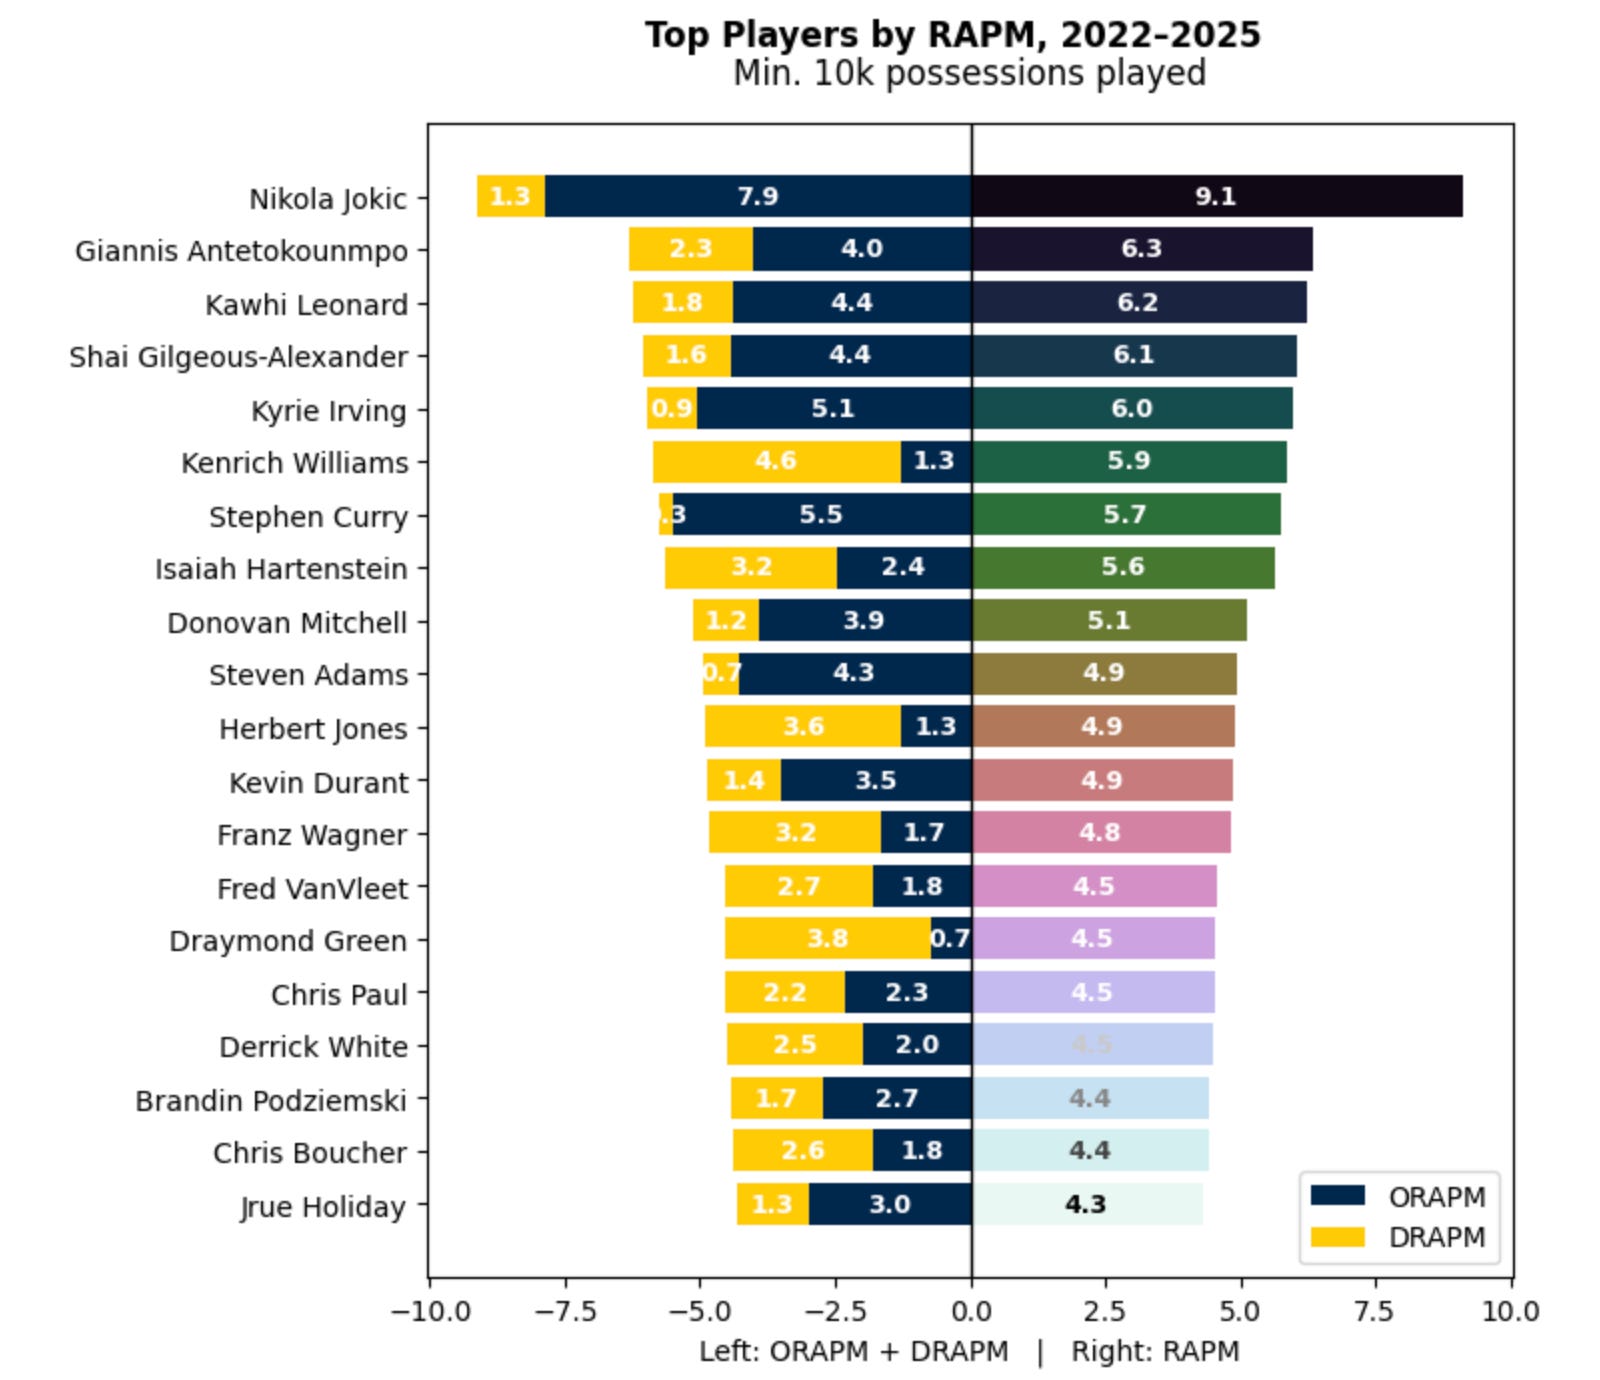
Jokic’s 7.9 ORAPM stands out as equally impressive as his 9.1 overall RAPM. Other top offensive contributors include Steph Curry, Kyrie Irving, SGA, and Kawhi. Kyrie and Steph’s offensive abilities are so significant that they appear in the top 7 of RAPM with very small DRAPM values.
We’re also able to see the defensive stalwarts: Kenrich Williams (more on him later), Hartenstein, Herb Jones, Franz, and Draymond.
So job done, right? Not so fast - remember the scheduling effects, coaching, and other contributing factors I noted? We can actually add them directly into the RAPM model.
Adding Context to RAPM: RAPM+
Our matrix that began with APM has a binary value for each player on offense and defense. At any given time, there should be 10 1s representing each player on the court and a lot of 0s representing every other player not on the court in this 4 year span.
We can add new columns representing the context we’ve been missing until now. I’ll now add several variables that should strengthen our ability to give a more true player impact reading which I’ll call RAPM+:
Home Court Advantage
While there is debate as to how much home court advantage is due to rest/travel benefits, it’s a real impact on the game. In the last four regular seasons, home teams won 55.3% of games. By adding this variable, we’re able to understand the effect of home court advantage on every possession and separate it from the players’ impact.
Rest
I’ve added the following rest effects to my model:
1 day rest (standard)
2+ days rest (rested)
0 days rest (back to back)
3 games in 4 nights
Coaching
Coaching has been difficult to measure given its many attributes (out of bounds play effectiveness, timeout effectiveness, coach’s challenge usage, etc.). Some of the most impactful areas of coaching can be nearly impossible to measure, including game planning, lineup & rotation decisions, aligning team focus, building a community, etc.
The most simple approach is to simply treat the coach like a 6th player on the court for each team by adding them into directly into the matrix and letting the model determine their impact.
We can then visualize coach success in terms of RAPM as well:
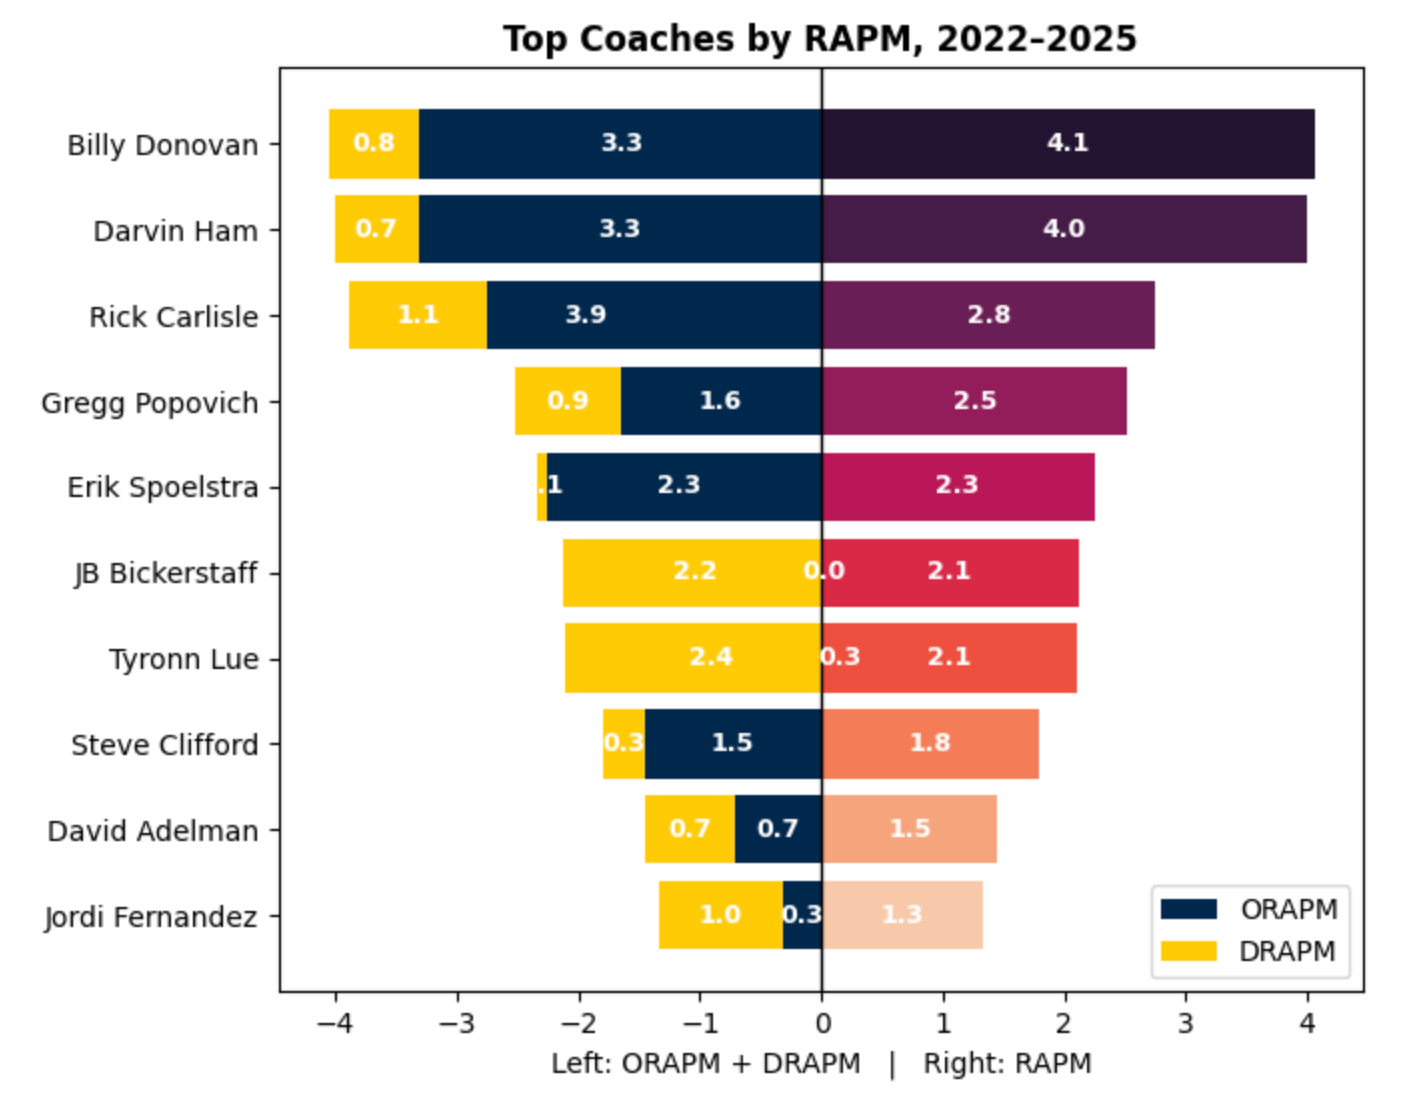
I believe these names should be taken with a grain of salt due to the effect of multicollinearity. Given the coach will be “on the court” at all times with the players, it is difficult for a model to separate everyone’s individual impact.
In basketball terms, it’s a bit of a chicken-and-egg scenario - is Steve Kerr responsible for the Warriors success, or was it the perfect storm of a budding Curry/Klay/Draymond that should be mostly responsible? Kerr probably deserves to be on this list, but the model has a hard time determining how much the Warriors’ success is due to Kerr himself.
Team Strength
Capturing team strength is essential to understanding player performance. We saw Luke Kornet had the #1 plus-minus since 2022, and that’s not because of the Kornet Kontest. It’s because he’s played for the Celtics for the majority of this time, who have won 61, 64, 57, and 51 games the last four years.
To capture team strength, I’ve used average net rating over the past 50 games entering each game.
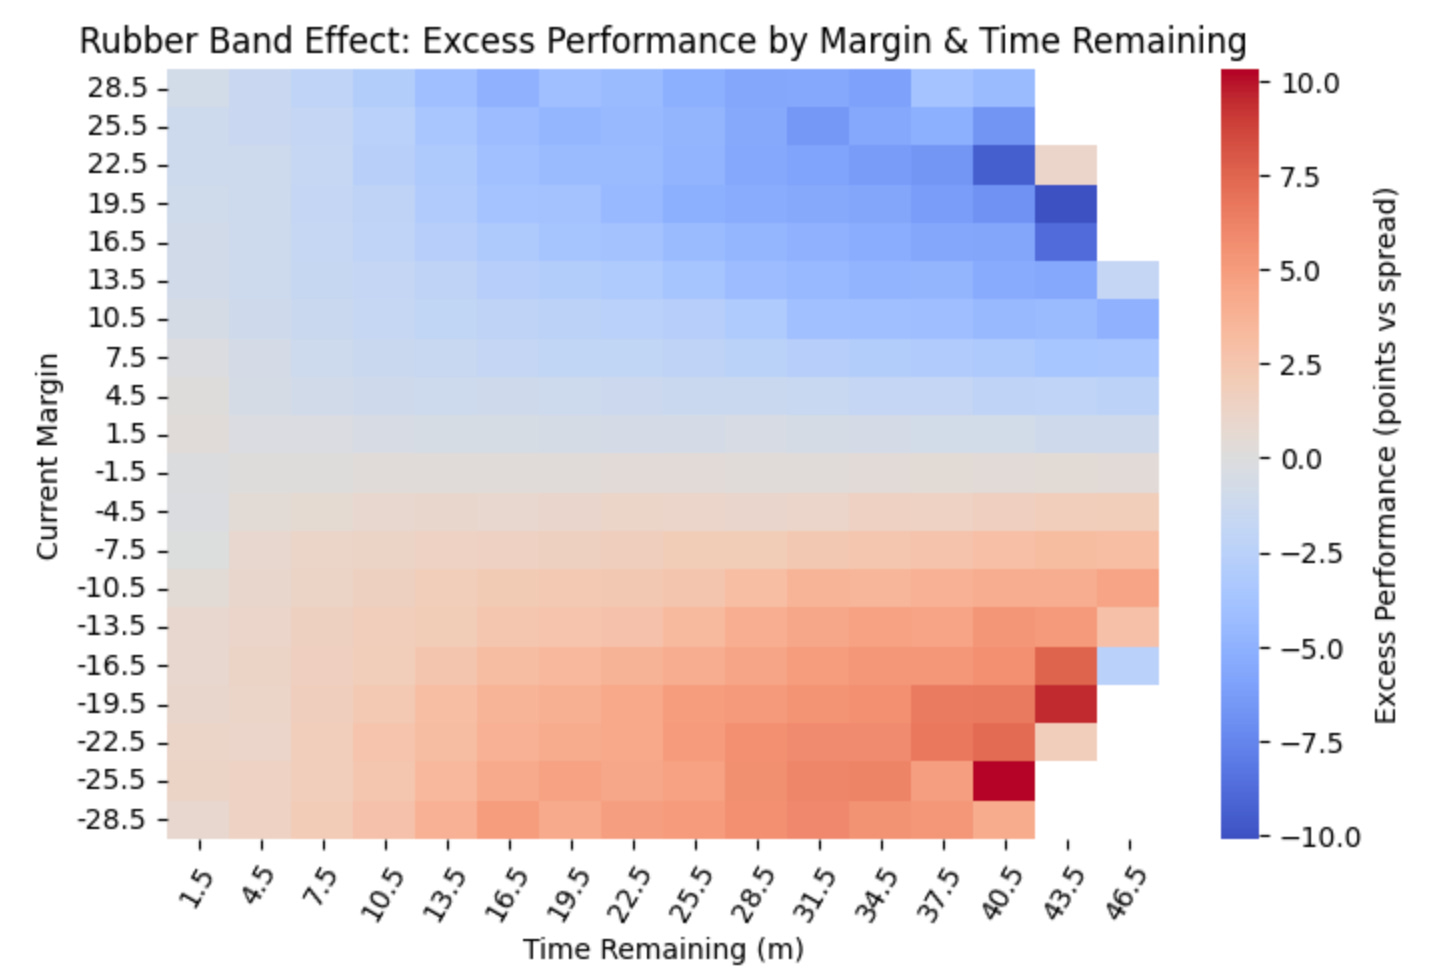
Rubberband Effect
The rubberband effect refers to the way that winning teams take their foot off the gas and losing teams increase their focus.
The data backs this up - I evaluated margins across 14.8 million timestamps from 2006-2021 and found that teams who found themselves down big margins started outperforming their opponents by as much as 10 points per 100 possessions:
Luck
I’m a big believer in the power of luck. We don’t talk about it enough, but it exists in the NBA. One measure of luck is how often teammates and opponents make their free throws and three-pointers, two highly variable events that are relatively unaffected by the 9 non-shooters on the court.
Take Chris Duarte. In his 177 games across 4 seasons, based on career averages, his opponents were expected to make 76.9% of their free throws on 1,146 attempts. They made 79.5% instead. To make matters worse, his teammates made 75.0% when they were expected to make 77.0%! Is this his fault? Surely not, and we can fix this.
Using player career average free throw and three-point success entering each game, I created expected points made for each player’s teammates and opponents.
For each possession with a three point or free throw attempt, I adjusted the actual points to expected points using a 50% blend of shooter career average and actual result.
After including these variables in our model, we now have RAPM+, a RAPM-type reading that separates player impact from all of these factors:
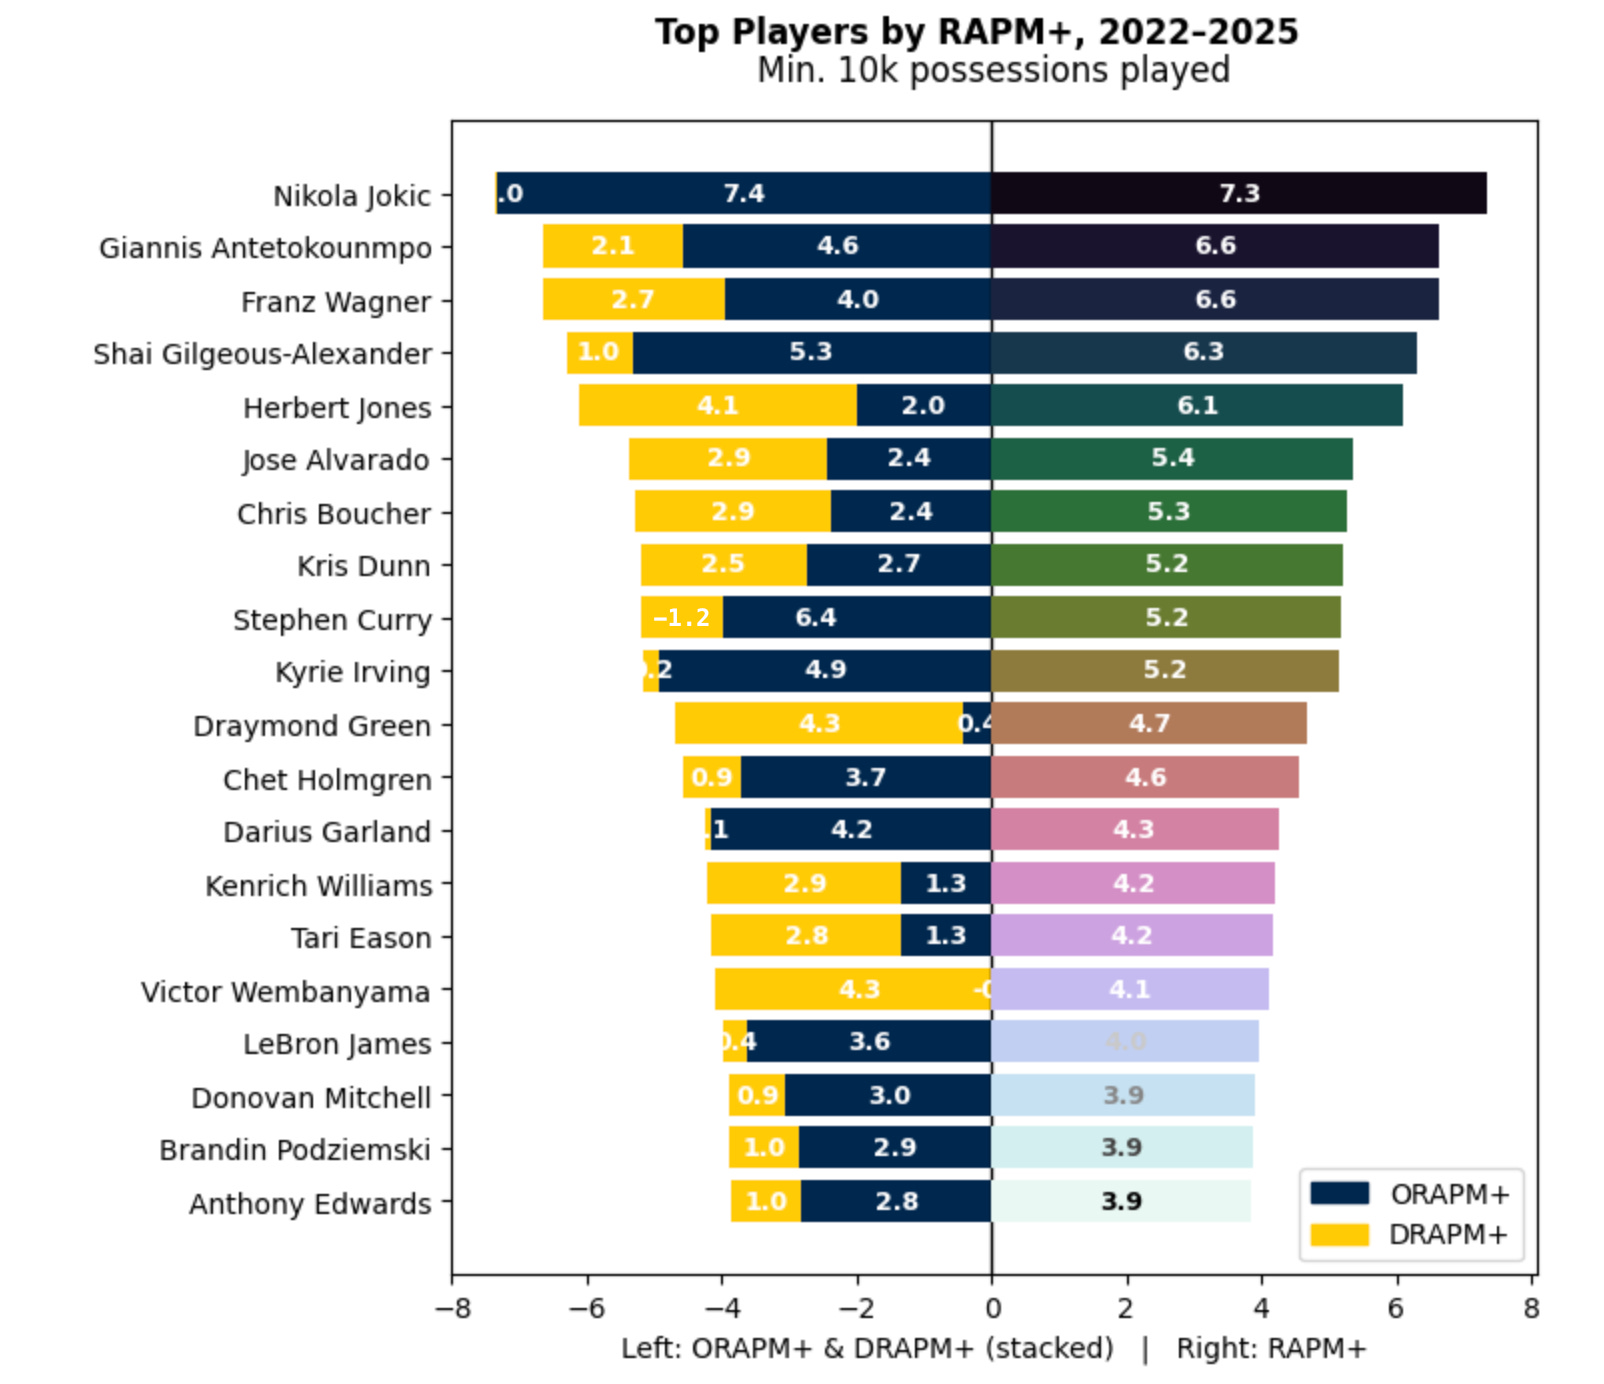
Note many of the same All-NBA players pop to the top, but there are some differences compared to the previous RAPM reading.
Kenrich Williams falls from #6 to #14, likely due to (1) the net rating of the Thunder during the last four years, and (2) his luck - he ranks #2 in three-point luck, with opponents making 33.0% on an expected 35.9%.
Chris Boucher rises from #19 to #7 for the opposite reason. Despite the Raptors heavily struggling the previous two seasons (30 and 25 wins), he’s a positive plus-minus player (0.9 per 100 poss.). His opponents made 79.9% of their free throws on an expected 77.0%.
Adding this context to player value readings is incredibly helpful to NBA front offices, as we can start to parse why a player succeeds and separate true impact from luck.
Introducing RAPM-EU
I’d now like to take everything from the previous step and add in a new dimension based on efficiency and usage.
I chose both efficiency and usage because they’re often diametrically opposed to one another. Most of the time, as usage increases, efficiency decreases. The most special players in the league can do both - they can provide reliable, efficient, and self-starting offense
To do this, I’ll use a concept called adding priors. A “prior” represents the beliefs we have before observing some data. I can add in various datapoints on players before modeling RAPM, which will influence our end result.
On offense, the priors I’ll be using are:
True shooting %, with unassisted field goals receiving a 35% boost
Turnovers per 100 possessions
Offensive rebound %
Assists per 100 possessions
Free throws made per 100 possessions
Defensive priors:
Opponent true shooting %, with unassisted field goals receiving a 35% boost
Opponent turnovers per 100 possessions
Defensive rebound %
Opponent assists per 100 possessions
Opponent free throws made per 100 possessions
Stops per 100 possessions
I chose these variables because each relates to efficiency and/or usage:
True shooting % measures shooting efficiency while properly weighting 3-point and free throw success. I gave unassisted field goals a 35% boost to reward players who can efficiently create their own shot, as this is incredibly valuable especially in the playoffs.
Turnovers are inherently related to efficiency as the offense can’t score on a turnover, and turnovers often allow highly efficient scoring opportunities for the team securing possession
Rebound % measures a player’s ability to secure (or prevent) highly efficient putback opportunities
Assists are also rewarded as the player who makes the pass is creating efficient offense for their team. Defensively, players who prevent assists are forcing inefficient possessions.
Free throws are some of the most efficient offense. I chose to reward free throws made, not attempted, as I wanted to focus on a player’s ability to both create and convert free throw opportunities
Stops refer to a player’s singular ability to stop a possession. This is represented by charges drawn, steals, and blocks recovered.
To add priors to my RAPM+ model, I ran the exact same RAPM+ process for the previous four years, 2018 to 2021. At a high level, I then modeled the relationship between the offensive and defensive priors and RAPM+ values from 2018-2021.
Using this information, I could estimate RAPM for each player in the 2022-2025 period. In our system of equations, each player’s RAPM will now shrink toward his predicted RAPM value instead of 0.
Finally, we now have RAPM-EU, a measure of how each player drives winning for his team with a focus on efficiency and usage:
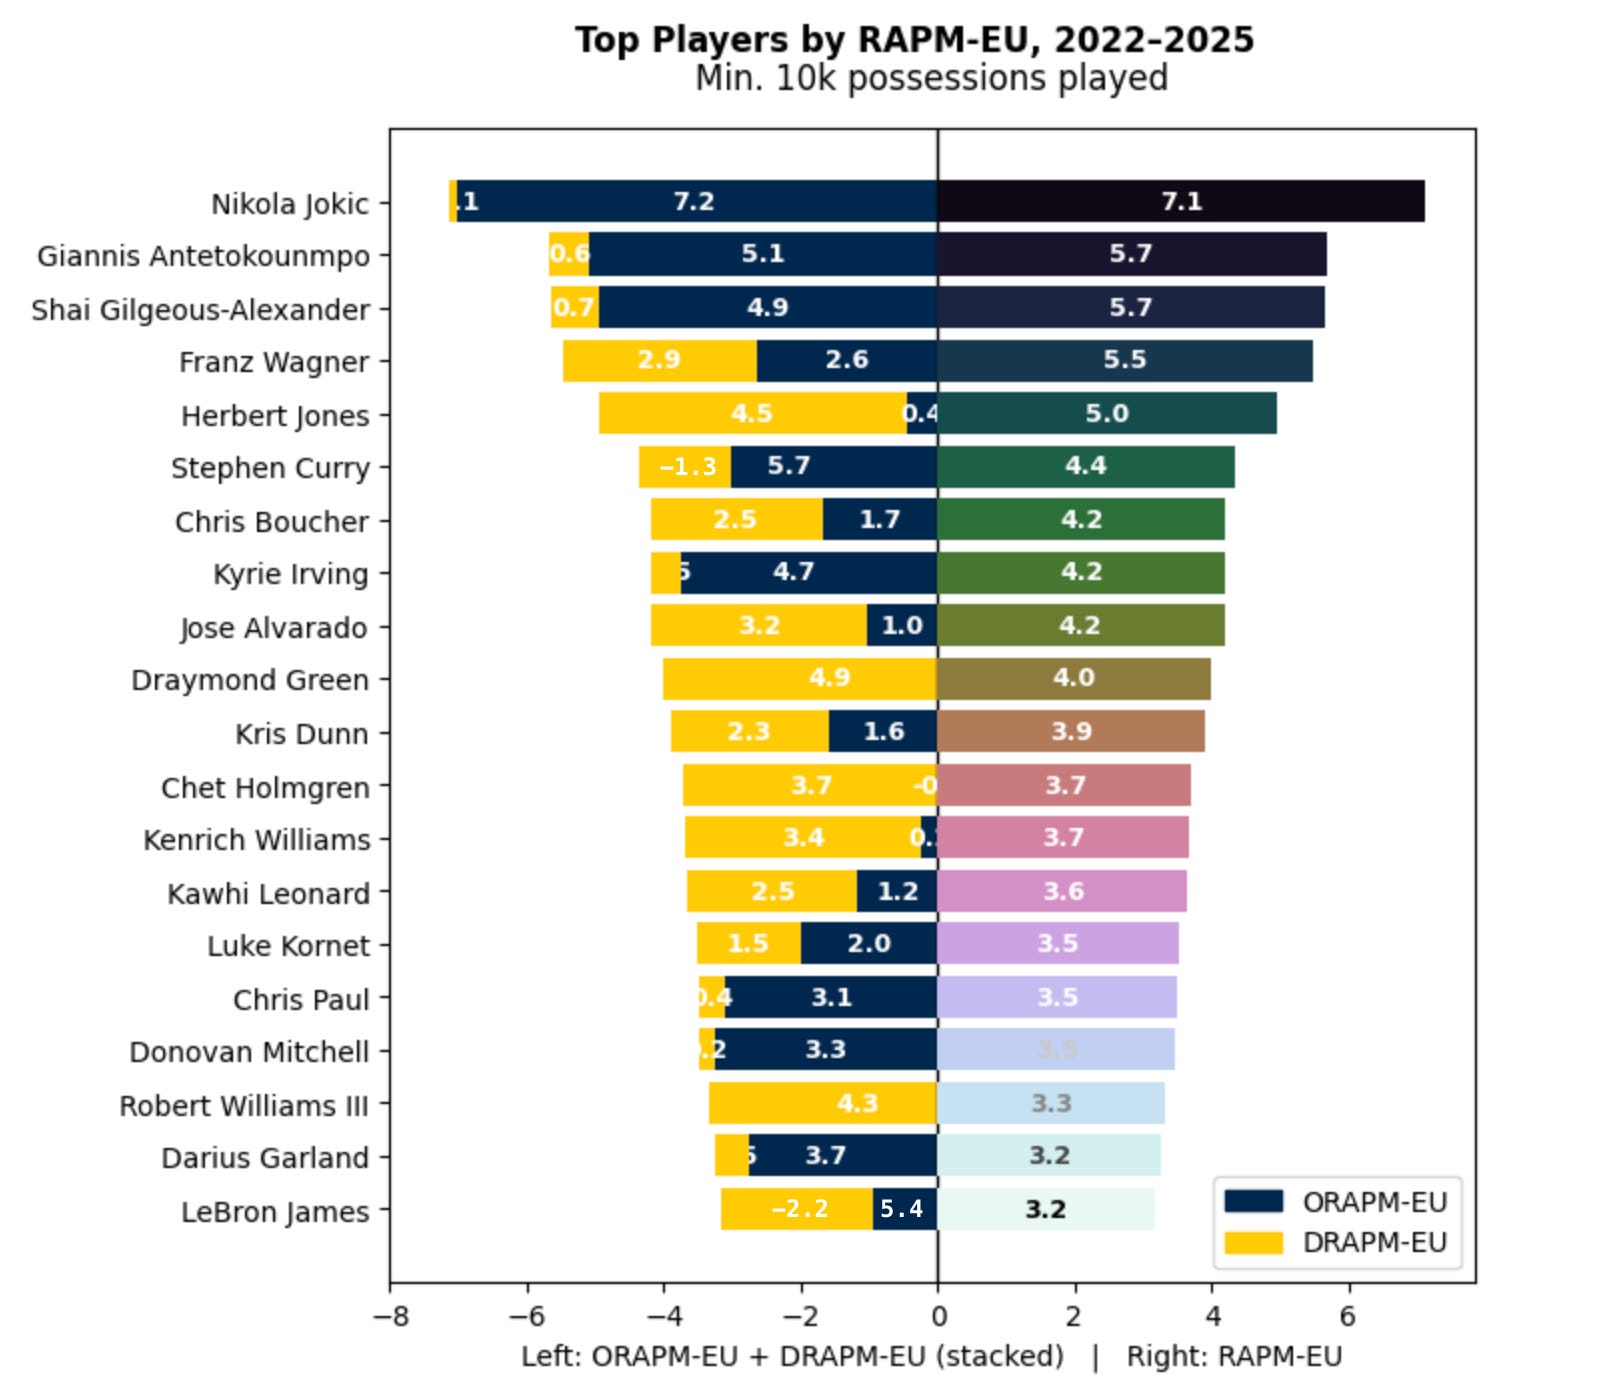
(note bar size may not be indicative of true ORAPM-EU and DRAPM-EU values as negative values create visual complications)
RAPM-EU doesn’t differ much from RAPM+, but I notice a few things:
Jokic reclaims a bigger lead from the rest of the pack compared to RAPM+, as his combination of efficiency and usage is part of what makes him a generational talent
SGA leapfrogs Franz with his ability to efficiently create his own shot
Wemby disappears from the top #20 - despite having the #1 ranked DRAPM-EU, his below-average offensive true shooting % causes him to fall
Closing Thoughts
One number player value metrics can be incredibly insightful, especially when parsed apart, but should be used cautiously. I love Jose Alvarado as much as the next guy, but I’m not ready to say he’s the 9th best player in the NBA.
It’s better to use these metrics like tools in a tool belt, with an understanding of when to apply each one, and how to use them in coordination with other metrics.
I’d like to think of RAPM-EU as a USB-C charger - one cable, useful across a variety of devices, but did we really need it? *shakes fist at Apple*
Personal news: Unfortunately my UX research group at Google has been laid off. I’m seeking new opportunities in data science, research, marketing, and basketball. Please get in touch at kevin.dewandeler@gmail.com if you’d like to discuss opportunities with me.
Special thanks to Jeremias Englemann, as his guidance assisted me in applying box score priors.
Fascinating to see this the same day as Nate Silver’s blog also used RAMP to evaluate Wemby and to see what your adjustments do differently. https://www.natesilver.net/p/can-wemby-make-the-mvp-leap
Thanks!
This is unbelievably impressive. Thanks for sharing. Would love to see the full list.